Note
Click here to download the full example code
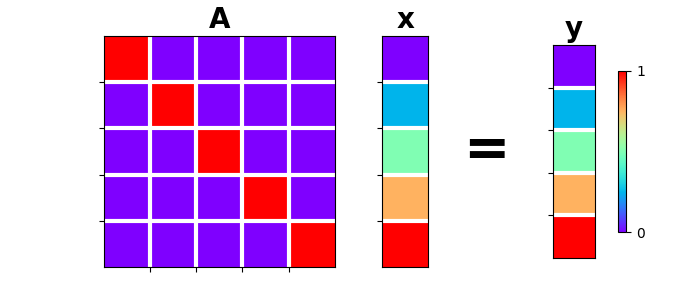
Identity
This example shows how to use the pylops.Identity operator to transfer model
into data and viceversa.
import torch
import numpy as np
import matplotlib.pyplot as plt
import matplotlib.gridspec as pltgs

import pylops_gpu

plt.close('all')
Let’s define an identity operator \(\mathbf{I}\) with same number of elements for data \(N\) and model \(M\).
N, M = 5, 5
x = torch.arange(M, dtype=torch.int)
Iop = pylops_gpu.Identity(M, dtype=torch.int)

y = Iop * x
xadj = Iop.H * y

gs = pltgs.GridSpec(1, 6)
fig = plt.figure(figsize=(7, 3))
ax = plt.subplot(gs[0, 0:3])
im = ax.imshow(np.eye(N), cmap='rainbow')
ax.set_title('A', size=20, fontweight='bold')
ax.set_xticks(np.arange(N-1)+0.5)
ax.set_yticks(np.arange(M-1)+0.5)
ax.grid(linewidth=3, color='white')
ax.xaxis.set_ticklabels([])
ax.yaxis.set_ticklabels([])
ax = plt.subplot(gs[0, 3])
ax.imshow(x[:, np.newaxis], cmap='rainbow')
ax.set_title('x', size=20, fontweight='bold')
ax.set_xticks([])
ax.set_yticks(np.arange(M-1)+0.5)
ax.grid(linewidth=3, color='white')
ax.xaxis.set_ticklabels([])
ax.yaxis.set_ticklabels([])
ax = plt.subplot(gs[0, 4])
ax.text(0.35, 0.5, '=', horizontalalignment='center',
        verticalalignment='center', size=40, fontweight='bold')
ax.axis('off')
ax = plt.subplot(gs[0, 5])
ax.imshow(y[:, np.newaxis], cmap='rainbow')
ax.set_title('y', size=20, fontweight='bold')
ax.set_xticks([])
ax.set_yticks(np.arange(N - 1) + 0.5)
ax.grid(linewidth=3, color='white')
ax.xaxis.set_ticklabels([])
ax.yaxis.set_ticklabels([])
fig.colorbar(im, ax=ax, ticks=[0, 1], pad=0.3, shrink=0.7)
Out:
<matplotlib.colorbar.Colorbar object at 0x7f28aaa6d5f8>
Similarly we can consider the case with data bigger than model
Out:
x = tensor([0, 1, 2, 3, 4], dtype=torch.int32)
I*x = tensor([0, 1, 2, 3, 4, 0, 0, 0, 0, 0], dtype=torch.int32)
I'*y = tensor([0, 1, 2, 3, 4], dtype=torch.int32)
and model bigger than data
Out:
x = tensor([0, 1, 2, 3, 4, 5, 6, 7, 8, 9], dtype=torch.int32)
I*x = tensor([0, 1, 2, 3, 4], dtype=torch.int32)
I'*y = tensor([0, 1, 2, 3, 4, 0, 0, 0, 0, 0], dtype=torch.int32)
Total running time of the script: ( 0 minutes 0.163 seconds)